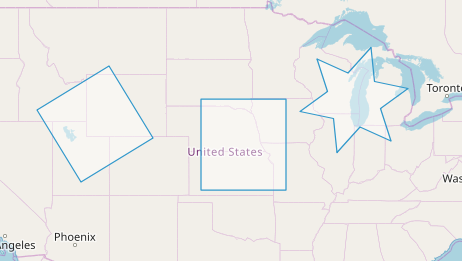
openlayers之绘制矩形星星拉框放大自定义图形
目录
openlayers绘制矩形、星星、拉框放大等自定义图形

简介:openlayers绘制矩形、星星、拉框绘制,以及自定义图形。
实际是对ol.interaction.Draw的扩展,geometryFunction属性。
初始化绘制矢量图层
 var source = new ol.source.Vector({wrapX: false});

 var vector = new ol.layer.Vector({
        source: source
      });
初始化地图加载底图
var raster = new ol.layer.Tile({
        source: new ol.source.OSM()
      });
var map = new ol.Map({
        layers: [raster, vector],
        target: 'map',
        view: new ol.View({
          center: [-11000000, 4600000],
          zoom: 4
        })
      });
添加绘制interaction
//根据不同类型设置不同geometryFunction;
var drawType='None',//绘制类型 geometryFunction =null;
//绘制图形方法函数
if (value === 'Square') {
//矩形
drawType = 'Circle';
geometryFunction = ol.interaction.Draw.createRegularPolygon(4); } else if (value === 'Box') {//拉框矩形 drawType = 'Circle'; geometryFunction = ol.interaction.Draw.createBox(); } else if (value === 'Star') {//星星,可自定义图形 drawType = 'Circle'; geometryFunction = function(coordinates, geometry) { if (!geometry) {//根据绘制的坐标返回自定义的geometry,随意拓展 geometry = new ol.geom.Polygon(null); } var center = coordinates[0]; var last = coordinates[1]; var dx = center[0] - last[0]; var dy = center[1] - last[1]; var radius = Math.sqrt(dx * dx + dy * dy); var rotation = Math.atan2(dy, dx); var newCoordinates = []; var numPoints = 12; for (var i = 0; i < numPoints; ++i) { var angle = rotation + i * 2 * Math.PI / numPoints; var fraction = i % 2 === 0 ? 1 : 0.5; var offsetX = radius * fraction * Math.cos(angle); var offsetY = radius * fraction * Math.sin(angle); newCoordinates.push([center[0] + offsetX, center[1] + offsetY]); } newCoordinates.push(newCoordinates[0].slice()); geometry.setCoordinates([newCoordinates]); return geometry; }; } var draw = new ol.interaction.Draw({ source: source, type: 'Point', //Point 点;LineString 线;Polygon 面;Circle 圆;None 空; geometryFunction: geometryFunction }); map.addInteraction(draw);
相关推荐:openlayers绘制点线面:https://www.giserdqy.com/gis/opengis/ol5/6461


From adding layers to customizing the map controls, it’s clear that OpenLayers offers a lot of flexibility for creating dynamic and engaging maps.