http://blog.csdn.net/gisshixisheng/article/details/47955787
概述:
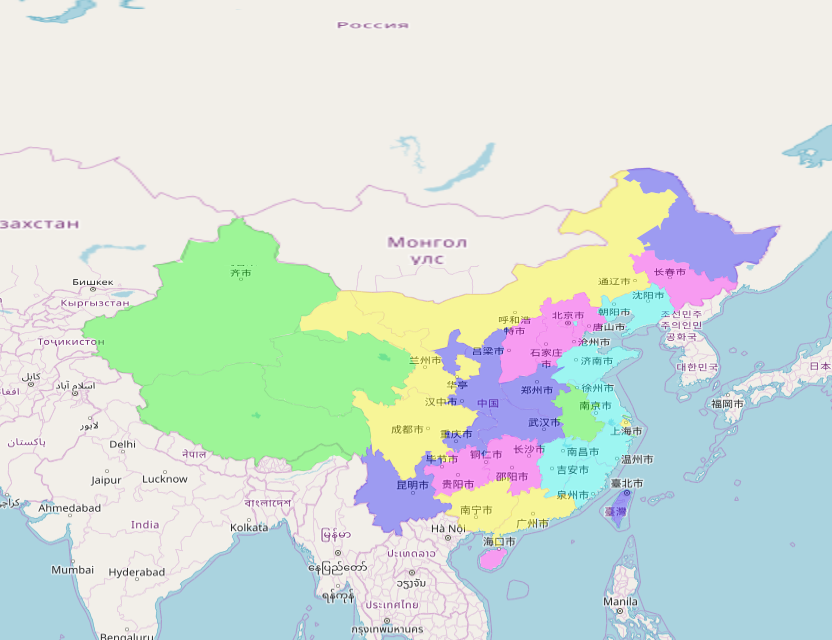
本文讲述如何在OpenLayers中调用Arcgis Server切片并显示。
思路:
在OpenLayers中加载Arcgis Server切片用XYZ图层,Arcgis Server的切片调用地址我们可以看到如下:
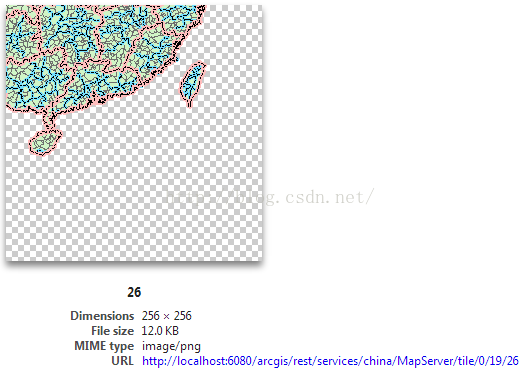

可以看到,切片的请求地址为http://localhost:6080/arcgis/rest/services/china/MapServer/z/y/x,其中,z为缩放级别,x,y分别为改切片距离tileOrigin的行列号,其计算方式为:
- var res = this.getResolution();
- var originTileX = (this.tileOrigin.lon + (res * this.tileSize.w/2));
- var originTileY = (this.tileOrigin.lat – (res * this.tileSize.h/2));
- var center = bounds.getCenterLonLat();
- var point = { x: center.lon, y: center.lat };
- var x = (Math.round(Math.abs((center.lon – originTileX) / (res * this.tileSize.w))));
- var y = (Math.round(Math.abs((originTileY – center.lat) / (res * this.tileSize.h))));
- var z = this.map.getZoom();
将之封装为一个OpenLayers扩展类OpenLayers.Layer.AgsTileLayer,该类的代码方式为:
- OpenLayers.Layer.AgsTileLayer = OpenLayers.Class(OpenLayers.Layer.XYZ, {
- url: null,
- tileOrigin: null,
- tileSize: new OpenLayers.Size(256, 256),
- type: ‘png’,
- useScales: false,
- overrideDPI: false,
- initialize: function(name, url, options) {
- OpenLayers.Layer.XYZ.prototype.initialize.apply(this, arguments);
- },
- getURL: function (bounds) {
- var res = this.getResolution();
- var originTileX = (this.tileOrigin.lon + (res * this.tileSize.w/2));
- var originTileY = (this.tileOrigin.lat – (res * this.tileSize.h/2));
- var center = bounds.getCenterLonLat();
- var point = { x: center.lon, y: center.lat };
- var x = (Math.round(Math.abs((center.lon – originTileX) / (res * this.tileSize.w))));
- var y = (Math.round(Math.abs((originTileY – center.lat) / (res * this.tileSize.h))));
- var z = this.map.getZoom();
- var url = this.url;
- var s = ” + x + y + z;
- if (OpenLayers.Util.isArray(url)) {
- url = this.selectUrl(s, url);
- }
- url = url + ‘/tile/${z}/${y}/${x}’;
- url = OpenLayers.String.format(url, {‘x’: x, ‘y’: y, ‘z’: z});
- return OpenLayers.Util.urlAppend(
- url, OpenLayers.Util.getParameterString(this.params)
- );
- },
- CLASS_NAME: ‘OpenLayers.Layer.AgsTileLayer’
- });
调用方式为:
- <script src=“AgsTileLayer.js”></script>
- var tiled = new OpenLayers.Layer.AgsTileLayer( “AGSCache”,
- “http://localhost:6080/arcgis/rest/services/china/MapServer”, {
- isBaseLayer: true,
- tileSize: new OpenLayers.Size(256, 256),
- resolutions: [
- 0.07614275218656896,
- 0.03807137609328448,
- 0.01903568804664224,
- 0.00951784402332112,
- 0.00475892201166056
- ],
- tileOrigin: new OpenLayers.LonLat(-400 , 400),
- maxExtent: bounds,
- projection: ‘EPSG:4326’
- });
- map.addLayers([tiled]);
代码中涉及到的参数可以从http://localhost:6080/arcgis/rest/services/china/MapServer?f=pjson返回的JSON数据中获取,如下:
-
- {
- “capabilities” : “Map,Query,Data”,
- “copyrightText” : “”,
- “currentVersion” : 10.110,
- “description” : “”,
- “documentInfo” : {
- “AntialiasingMode” : “None”,
- “Author” : “”,
- “Category” : “”,
- “Comments” : “”,
- “Keywords” : “”,
- “Subject” : “”,
- “TextAntialiasingMode” : “Force”,
- “Title” : “”
- },
- “fullExtent” : {
- “spatialReference” : {
- “latestWkid” : 4326,
- “wkid” : 4326
- },
- “xmax” : 134.9767976465060,
- “xmin” : 73.45100463562233,
- “ymax” : 53.53194315222358,
- “ymin” : 18.16324718764174
- },
- “initialExtent” : {
- “spatialReference” : {
- “latestWkid” : 4326,
- “wkid” : 4326
- },
- “xmax” : 138.0530872970502,
- “xmin” : 70.37471498507816,
- “ymax” : 55.85657468506156,
- “ymin” : 35.30335092712114
- },
- “layers” : [
- {
- “defaultVisibility” : true,
- “id” : 0,
- “maxScale” : 0,
- “minScale” : 0,
- “name” : “province”,
- “parentLayerId” : -1,
- “subLayerIds” : null
- },
- {
- “defaultVisibility” : true,
- “id” : 1,
- “maxScale” : 0,
- “minScale” : 0,
- “name” : “bcity”,
- “parentLayerId” : -1,
- “subLayerIds” : null
- },
- {
- “defaultVisibility” : true,
- “id” : 2,
- “maxScale” : 0,
- “minScale” : 0,
- “name” : “bcounty”,
- “parentLayerId” : -1,
- “subLayerIds” : null
- }
- ],
- “mapName” : “Layers”,
- “maxImageHeight” : 2048,
- “maxImageWidth” : 2048,
- “maxRecordCount” : 1000,
- “maxScale” : 1000000,
- “minScale” : 32000000,
- “serviceDescription” : “”,
- “singleFusedMapCache” : true,
- “spatialReference” : {
- “latestWkid” : 4326,
- “wkid” : 4326
- },
- “supportedImageFormatTypes” : “PNG32,PNG24,PNG,JPG,DIB,TIFF,EMF,PS,PDF,GIF,SVG,SVGZ,BMP”,
- “supportedQueryFormats” : “JSON, AMF”,
- “supportsDynamicLayers” : false,
- “tables” : [],
- “tileInfo” : {
- “cols” : 256,
- “compressionQuality” : 0,
- “dpi” : 96,
- “format” : “PNG”,
- “lods” : [
- {
- “level” : 0,
- “resolution” : 0.07614275218656896,
- “scale” : 32000000
- },
- {
- “level” : 1,
- “resolution” : 0.03807137609328448,
- “scale” : 16000000
- },
- {
- “level” : 2,
- “resolution” : 0.01903568804664224,
- “scale” : 8000000
- },
- {
- “level” : 3,
- “resolution” : 0.009517844023321120,
- “scale” : 4000000
- },
- {
- “level” : 4,
- “resolution” : 0.004758922011660560,
- “scale” : 2000000
- },
- {
- “level” : 5,
- “resolution” : 0.002379461005830280,
- “scale” : 1000000
- }
- ],
- “origin” : {
- “x” : -400,
- “y” : 400
- },
- “rows” : 256,
- “spatialReference” : {
- “latestWkid” : 4326,
- “wkid” : 4326
- }
- },
- “units” : “esriDecimalDegrees”
- }