openlayers4结合高德地图API实现路径规划
目录
概述
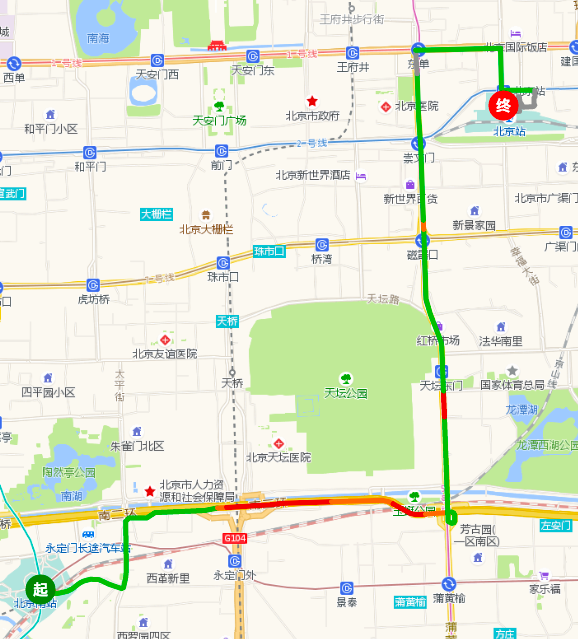
本文讲述如何结合高德地图API实现路径导航以及在Openlayers4中的展示。
效果


实现
- 获取数据
数据的获取是通过高德的API来实现,实现代码如下:
<!doctype html>
<html>
<head>
    <meta charset="utf-8">
    <meta http-equiv="X-UA-Compatible" content="IE=edge">
    <meta name="viewport" content="initial-scale=1.0, user-scalable=no, width=device-width">
    <title>按起终点经纬度规划路线</title>
    <link rel="stylesheet" href="http://cache.amap.com/lbs/static/main1119.css"/>
    <style type="text/css">
        #panel {
            position: fixed;
            background-color: white;
            max-height: 90%;
            overflow-y: auto;
            top: 10px;
            right: 10px;
            width: 280px;
        }
    </style>
    <script type="text/javascript" src="http://webapi.amap.com/maps?v=1.4.3&key=您的key&plugin=AMap.Driving"></script>
    <script type="text/javascript" src="http://cache.amap.com/lbs/static/addToolbar.js"></script>
</head>
<body>
<div id="container"></div>
<div id="panel"></div>
<script type="text/javascript">
    //基本地图加载
    var map = new AMap.Map("container", {
        resizeEnable: true,
        center: [116.397428, 39.90923],//地图中心点
        zoom: 13 //地图显示的缩放级别
    });
    //构造路线导航类
    var driving = new AMap.Driving({
        map: map,
        panel: "panel"
    });
    // 根据起终点经纬度规划驾车导航路线
    driving.search(new AMap.LngLat(116.379028, 39.865042), new AMap.LngLat(116.427281, 39.903719));
    driving.on("complete", function (result) {
        console.log(JSON.stringify(result));
    })
</script>
</body>
</html>
获取后的数据格式如下:

2. 数据展示
<html xmlns="http://www.w3.org/1999/xhtml">
<head>
    <meta http-equiv="Content-Type" content="text/html; charset=utf-8" />
    <title>百度样式地图</title>
    <link rel="stylesheet" href="https://openlayers.org/en/v4.1.1/css/ol.css" type="text/css">
    <style type="text/css">
        body, #map {
            border: 0px;
            margin: 0px;
            padding: 0px;
            width: 100%;
            height: 100%;
            font-size: 13px;
            overflow: hidden;
        }
    </style>
    <!-- The line below is only needed for old environments like Internet Explorer and Android 4.x -->
    <script src="https://cdn.polyfill.io/v2/polyfill.min.js?features=requestAnimationFrame,Element.prototype.classList,URL"></script>
    <script src="https://openlayers.org/en/v4.1.1/build/ol.js"></script>
    <script type="text/javascript" src="../../../../plugin/jquery/jquery-1.8.3.js"></script>
    <script type="text/javascript">
        function init(){
            var projection = ol.proj.get("EPSG:3857");
            function getNavmapLayer(){
                return new ol.layer.Tile({
                    source: new ol.source.XYZ({
                        url:'http://webrd01.is.autonavi.com/appmaptile?x={x}&y={y}&z={z}&lang=zh_cn&size=1&scale=1&style=8'//7,8
                    }),
                    projection: projection
                });
            }
            var navlayer = getNavmapLayer();
            $.get("../data/route.json",null,function(result) {
                console.log(result);
                var startC = ol.proj.transform([result.start.location.lng, result.start.location.lat], "EPSG:4326", "EPSG:3857"),
                    endC = ol.proj.transform([result.end.location.lng, result.end.location.lat], "EPSG:4326", "EPSG:3857");
                var startF = new ol.Feature(new ol.geom.Point(startC));
                startF.name = result.start.name;
                var endF = new ol.Feature(new ol.geom.Point(endC));
                endF.name = result.end.name;
                var features = [startF, endF];
                var routes = result.routes;
                for(var i=0;i<routes.length;i++){
                    var _route = routes[i];
                    var steps = _route.steps;
                    for(var j=0;j<steps.length;j++){
                        var _step = steps[j];
                        var tmcsPaths = _step.tmcsPaths;
                        for(var m = 0;m<tmcsPaths.length;m++){
                            var _coord = [];
                            var path = tmcsPaths[m].path;
                            for(var k=0;k<path.length;k++){
                                var _path = path[k];
                                _coord.push(ol.proj.transform([_path.lng, _path.lat], "EPSG:4326", "EPSG:3857"))
                            }
                            var pathF = new ol.Feature(new ol.geom.LineString(_coord));
                            pathF.status = tmcsPaths[m].status;
                            features.push(pathF);
                        }

                    }
                }
                var vectorSource = new ol.source.Vector({
                    features: features
                });
                var vector = new ol.layer.Vector({
                    source: vectorSource,
                    style: function (feature) {
                        var name = feature.name, status = feature.status;
                        name = name?name.substring(0,1):"";
                        var color = "";
                        if(name==="起")color = "green";
                        else if(name==="终")color = "red";

                        var _color = "#8f8f8f";
                        if(status==="拥堵")_color="#e20000";
                        else if(status==="缓行")_color="#ff7324";
                        else if(status==="畅通")_color="#00b514";

                        return new ol.style.Style({
                            image: new ol.style.Circle({
                                radius: 15,
                                fill: new ol.style.Fill({
                                    color:color
                                })
                            }),
                            stroke: new ol.style.Stroke({
                                color: _color,
                                width: 5,
//                                lineDash:[10, 8]
                            }),
                            text: new ol.style.Text({
                                text: name,
                                font:"bold 15px 微软雅黑",
                                fill: new ol.style.Fill({
                                    color: 'white'
                                }),
                                textAlign:"center",
                                textBaseline:"middle"
                            })
                        })
                    }
                });
                var map = new ol.Map({
                    target: 'map',
                    layers: [navlayer, vector],
                    view: new ol.View({
                        center: ol.proj.transform([116.397428, 39.90923], 'EPSG:4326', 'EPSG:3857'),
                        zoom: 13,
                        minZoom: 3
                    })
                });
            });
       }
    </script>
</head>
<body onLoad="init()">
<div id="map">
</div>
</body>
</html>
技术博客
CSDN:http://blog.csdn.NET/gisshixisheng
博客园:http://www.cnblogs.com/lzugis/
在线教程
http://edu.csdn.Net/course/detail/799
Github
https://github.com/lzugis/
联系方式
| 类型 | 内容 |
|---|---|
| 1004740957 | |
| 公众号 | lzugis15 |
| niujp08@qq.com | |
| webgis群 | 1004740957 |
| Android群 | 337469080 |
| GIS数据可视化群 | 458292378 |

转载自:https://blog.csdn.net/GISShiXiSheng/article/details/78936830


