d3.js——绘制静态中国地图
绘制中国地图可分为三步:
一 、绘制投影函数:
//球面的Mercator投影是常用的分片式映射库(例如OpenLayers 和Leaflet)。例如显示栅格分片与Mercator投影,它是正形投影的
var projection = d3.geo.mercator()
    .center([107,31]) //用于设定地图的中心位置,[107,31] 指的是经度和纬度。
    .scale(850) //用于设定放大的比例。
    .translate([width/2,height/2]); //函数用于设定平移。
二、绘制path函数:
//设定path函数
var path = d3.geo.path()
    .projection(projection);
三、读取china.json文件并绘图:
d3.json("china.json",function(error,root){
if (error) return console.log(error);
svg.selectAll("path")
.data(root.features)
.enter()
.append("path")
.attr("stroke","#000")
.attr("stroke-width",1)
.attr("fill",function(d,i){return color(i)})
.attr("d",path)
.on("mouseover", function (d,i) {
d3.select(this)
.attr("fill","yellow")
})
.on("mouseout",function(d,i){
d3.select(this)
.attr("fill",color(i));
})
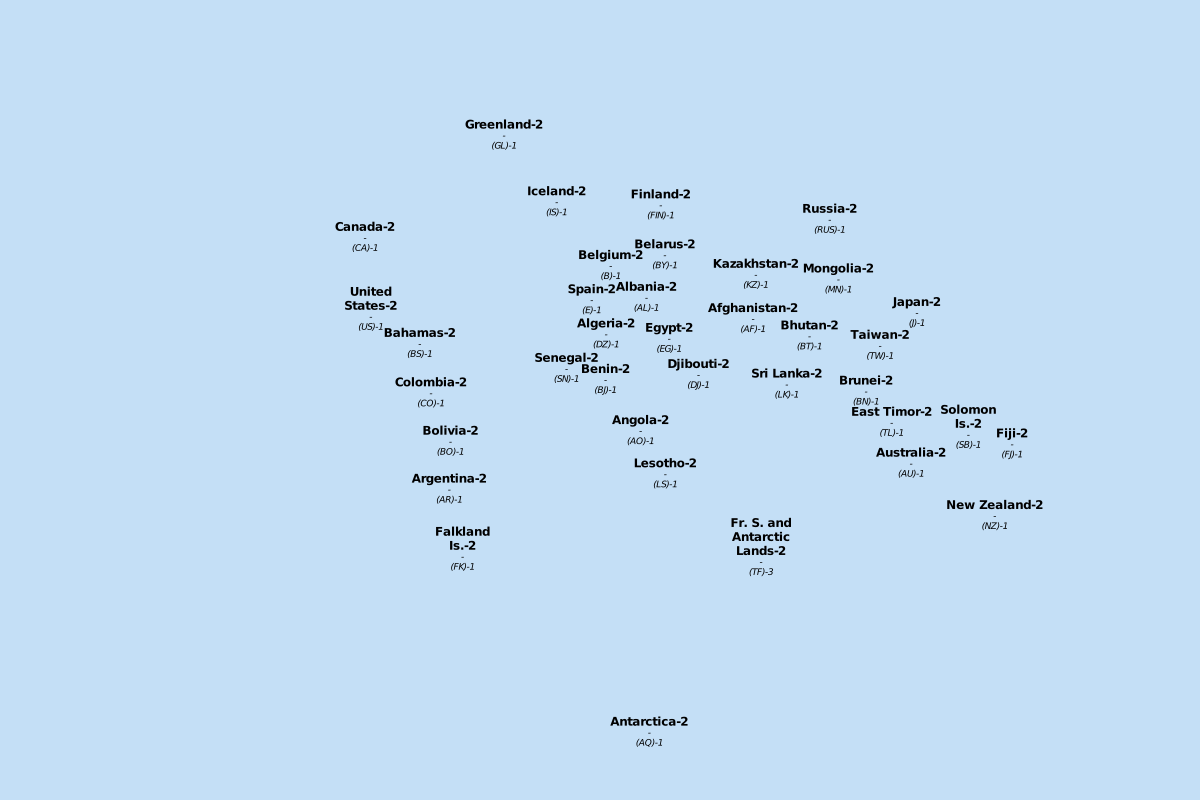
})效果如下图:

转载自:https://blog.csdn.net/Selina_Chan/article/details/51272619