Leaflet初体验0x4:交互式等值图
目录
利用GeoJSON和一些自定义控件创建一个彩色交互式美国各州人口密度分布图的案例。
数据源
GeoJSON数据(us-states.js)的每个要素结构如下:
{
    "type": "Feature",
    "properties": {
        "name": "Alabama",
        "density": 94.65
    },
    "geometry": ...
    ...
}
基础地图
使用自定义的Mapbox样式的将各州的数据展示到地图上,灰色瓦片是可视化处理时非常合适的背景色
<!DOCTYPE html>
<html>
<head>
<title>Interactive Choropleth Map</title>
<meta charset="utf-8">
<meta name="viewport" content="width=device-width,initial-scale=1.0">
<link rel="stylesheet" href="https://unpkg.com/leaflet@1.4.0/dist/leaflet.css" crossorigin="">
<script src="https://unpkg.com/leaflet@1.4.0/dist/leaflet.js" crossorigin=""></script>
<style>
html,body{
height: 100%;
margin: 0;
}
#map {
width: 750px;
height: 500px;
}
</style>
</head>
<body>
<div id="map"></div>
<script type="text/javascript" src="us-states.js"></script>
<script type="text/javascript">
//设置坐标和缩放比例
var map = L.map('map').setView([37.8,-96],4);
//绘制地图
L.tileLayer('https://api.tiles.mapbox.com/v4/{id}/{z}/{x}/{y}.png?access_token=pk.eyJ1IjoibWFwYm94IiwiYSI6ImNpejY4NXVycTA2emYycXBndHRqcmZ3N3gifQ.rJcFIG214AriISLbB6B5aw',{
attribution:'Map data ©<a href="https://www.openstreetmap.org/">OpenStreetMap</a>contributors, <a href="https://creativecommons.org/licenses/by-sa/2.0/">CC-BY-SA</a>, Imagery © <a href="https://www.mapbox.com/">Mapbox</a>',
maxZoom:18,
id:'mapbox.light'
}).addTo(map);
//添加数据
L.geoJson(statesData).addTo(map);
</script>
</body>
</html>

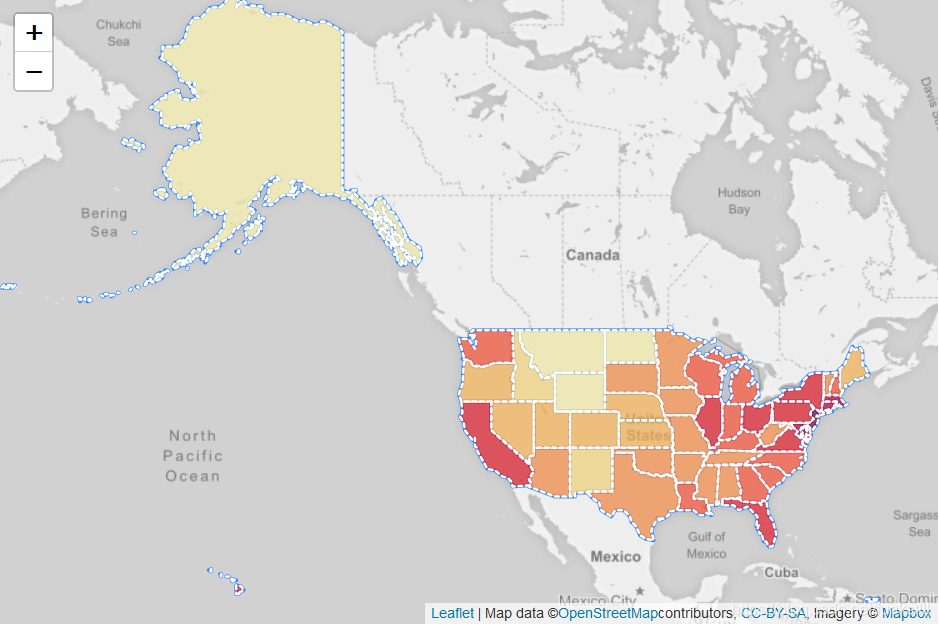
添加颜色
//定义颜色判断方法
function getColor(d){
	return d>1000?'#800026':
		   d>500 ?'#BD0026':
		   d>200 ?'#E31A1C':
		   d>100 ?'#FC4E2A':
		   d>50  ?'#FD8D3C':
		   d>20  ?'#FEB24C':
		   d>10  ?'#FED976':
				  '#FFEDA0';
}
//定义渲染方法
function style(feature){
	return {
		fillColor:getColor(feature.properties.density);,
		weight:2,
		opacity:1,
		color:'white',
		dashArray:'3',
		fillOpacity:0.7
	};
}
//将颜色设置到图层
L.geoJson(statesData,{style:style}).addTo(map);
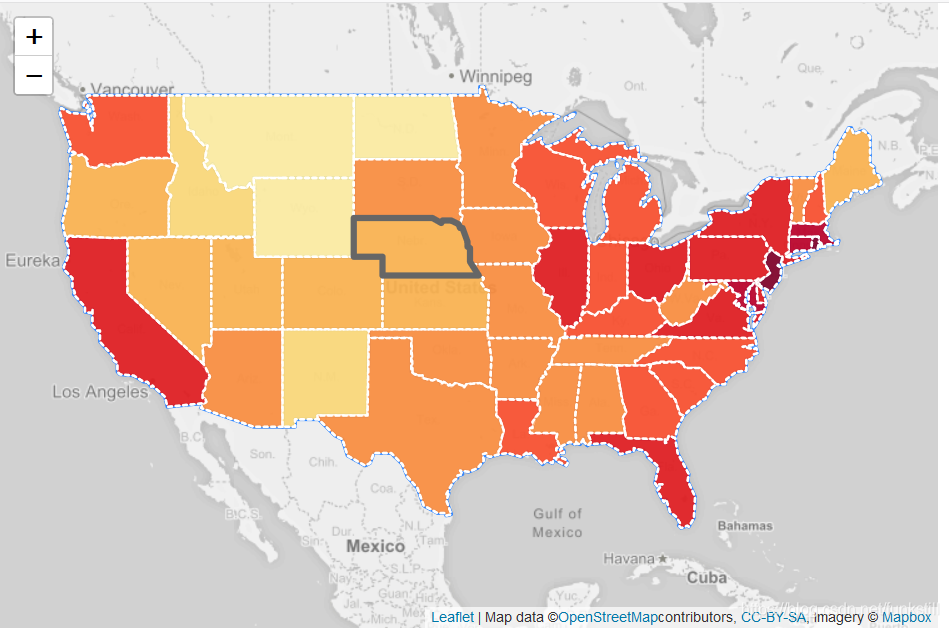
添加交互
//定义要素突出显示方法
function highlightFeature(e){
	var layer = e.target;
	layer.setStyle({
		weight:5,
		color:'#666',
		dashArray:'',
		fillOpacity:0.7
	});
	if(!L.Browser.ie&&!L.Browser.opera&&!L.Browser.edge){
		layer.bringToFront();
	}
}
var geojson;

//重置方法
function resetHighlight(e){
	geojson.resetStyle(e.target);
}
//跳转到所选州
function zoomToFeature(e){
	map.fitBounds(e.target.getBounds());
}
//绑定事件
function onEachFeature(feature,layer){
	layer.on({
		mouseover:highlightFeature,
		mouseout:resetHighlight,
		click:zoomToFeature
	});
}
geojson = L.geoJson(statesData,{
	style:style,
	onEachFeature:onEachFeature
}).addTo(map);
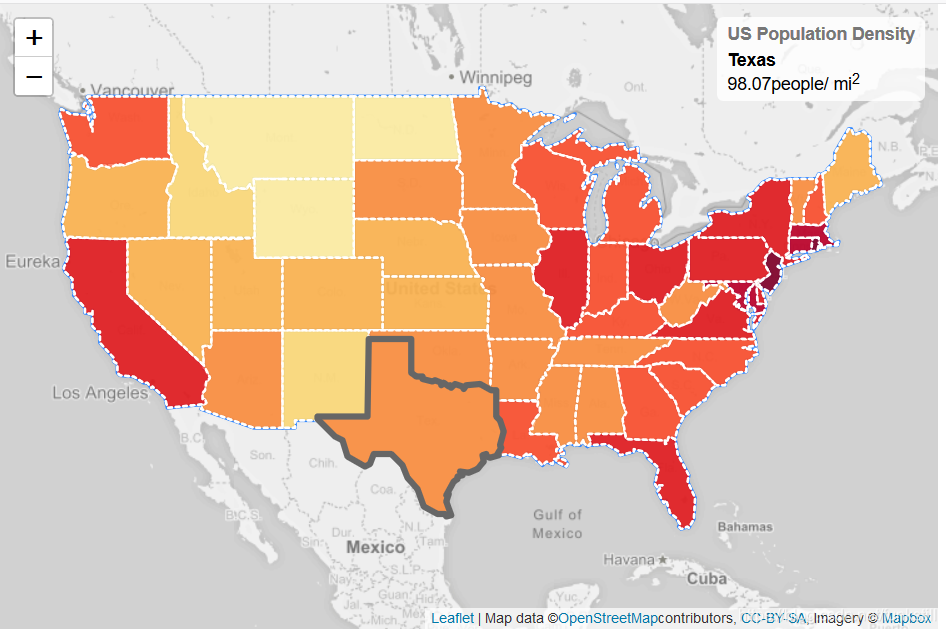
自定义信息控件
var info = L.control();
info.onAdd = function(map){
	this._div=L.DomUtil.create('div','info');//创建一个div class为info
	this.update();
	return this._div;
};
info.update = function(props){
	this._div.innerHTML = '<h4>US Population Density</h4>'+(props?
	'<b>'+props.name+'</b><br />'+props.density+'people/ mi<sup>2</sup>'
	:'Hover over a state');
};
info.addTo(map);
更新事件监听
//定义要素突出显示方法
function highlightFeature(e){
	...
	info.update(layer.feature.properties);
}
var geojson;

//重置方法
function resetHighlight(e){
	...
	info.update();
}
添加样式
.info{
	padding: 6px 8px;
	font:14px/16px Arial,Helvetica,sans-serif;
	background:white;
	background: rgba(255, 255,255, 0.8);
	box-shadow: 0 0 15px rgna(0,0,0,0,2);
	border-radius: 5px;
}
.info h4{
	margin: 0 0 5px;
	color: #777;
}
自定义图例控件
var legend = L.control({position:'bottomright'});
legend.onAdd = function(map){
var div = L.DomUtil.create('div','info legend'),
grades = [0,10,20,50,100,200,500,1000],
labels=[];
for(var i=0;i<grades.length;i++){
div.innerHTML +=
'<i style="background:'+getColor(grades[i]+1)+'"></i>'+
grades[i]+(grades[i+1]?'–'+grades[i+1]+'<br>':'+');
}
return div;
}
legend.addTo(map);
样式
.legend{
	line-height: 18px;
	color: #555;
}
.legend i{
	width: 18px;
	height: 18px;
	float: left;
	margin-right: 8px;
	opacity: 0.7;
}

转载自:https://blog.csdn.net/funkstill/article/details/86080075