R leaflet:多路线
library(shiny)
library(leaflet)
library(readr)
library(dplyr)
library(tidyr)
library(splitstackshape)
library(DT)
library(maptools)
options(shiny.maxRequestSize=1024*1024^2)
# 定义配色方案 ----
ui <- fluidPage(
useShinyjs(),
titlePanel("运单geohash与block相交路线Case分析工具"),
helpText("使用该SQL获取示例数据:select * from mart_peisongpa.geohash_block_route_analysis where dt=20180917 and distance0 > 0 and distance1 > 0 and distance2 > 0 and distance3 > 0 limit 1000"),
fileInput(inputId="segment_file", label="TSV文件", buttonLabel="浏览", placeholder="没有文件被选中"),
hr(),
helpText("输入"),
dataTableOutput("dt"),
leafletOutput("segment_plot", height=600)
)
# 服务端功能 ----
server <- function(input, output, session) {
segment_trace <- reactive({
segmentFile <- input$segment_file$datapath
if(is.null(input$segment_file)) {
segment_trace <- read_tsv("/home/test/zj/问题geohash分析/geohash_block_route") %>%
mutate(s_lng11=gh_decode(start_geohash)$lng-gh_decode(start_geohash)$lng_error, s_lng12=gh_decode(start_geohash)$lng+gh_decode(start_geohash)$lng_error,
s_lat11=gh_decode(start_geohash)$lat-gh_decode(start_geohash)$lat_error, s_lat12=gh_decode(start_geohash)$lat+gh_decode(start_geohash)$lat_error,
e_lng11=gh_decode(end_geohash)$lng-gh_decode(end_geohash)$lng_error, e_lng12=gh_decode(end_geohash)$lng+gh_decode(end_geohash)$lng_error,
e_lat11=gh_decode(end_geohash)$lat-gh_decode(end_geohash)$lat_error, e_lat12=gh_decode(end_geohash)$lat+gh_decode(end_geohash)$lat_error)
if(ncol(str_split(colnames(segment_trace), pattern="\\.", simplify = T)) == 2)
colnames(segment_trace) <- str_split(colnames(segment_trace), pattern="\\.", simplify = T)[,2]
return(segment_trace)
}
segment_trace <- read_tsv(segmentFile) %>%
mutate(s_lng11=gh_decode(start_geohash)$lng-gh_decode(start_geohash)$lng_error, s_lng12=gh_decode(start_geohash)$lng+gh_decode(start_geohash)$lng_error,
s_lat11=gh_decode(start_geohash)$lat-gh_decode(start_geohash)$lat_error, s_lat12=gh_decode(start_geohash)$lat+gh_decode(start_geohash)$lat_error,
e_lng11=gh_decode(end_geohash)$lng-gh_decode(end_geohash)$lng_error, e_lng12=gh_decode(end_geohash)$lng+gh_decode(end_geohash)$lng_error,
e_lat11=gh_decode(end_geohash)$lat-gh_decode(end_geohash)$lat_error, e_lat12=gh_decode(end_geohash)$lat+gh_decode(end_geohash)$lat_error)
if(ncol(str_split(colnames(segment_trace), pattern="\\.", simplify = T)) == 2)
colnames(segment_trace) <- str_split(colnames(segment_trace), pattern="\\.", simplify = T)[,2]
return(segment_trace)
})
output$dt <- renderDataTable({
segment_df <- segment_trace() %>%
tibble::rownames_to_column() %>%
select(bill_id, rider_id, city_id, start_geohash, end_geohash, delivery_distance, range, variance, standard_deviation, coefficient_of_variance, lng0, lat0, distance0, lng1, lat1, distance1, lng2, lat2, distance2, lng3, lat3, distance3)
datatable(segment_df, selection="single", filter="top")
})
output$segment_plot <- renderLeaflet({
row_id <- input$dt_row_last_clicked
if(is.null(row_id)) row_id <- 1
target_data <- segment_trace()
# 对应数据
segment_df <- target_data %>%
slice(row_id)
# block
block_df <- target_data %>%
slice(row_id) %>%
select(block) %>%
separate_rows(block, sep=";")
#mutate(block = map(block, ~fromJSON(as.character(.x)))) %>%
#unnest()
block_list <- purrr::map(block_df$block, jsonlite::fromJSON)
for (id in 1:length(block_list)) {
lines <- SpatialLines(list(Lines(Line(block_list[id]), ID=id)))
if(id == 1) {
block_lines <- lines
} else {
block_lines <- spRbind(block_lines, lines)
}
}
splines2splinesdf <- function(splines, id_field) {
ids <- data.frame(names(splines), stringsAsFactors =F)
colnames(ids) <- id_field
splinesdf <- SpatialLinesDataFrame(splines, data=ids)
proj4string(splinesdf ) <- CRS("+init=epsg:4326") # 设置投影坐标系,leaflet可以不用设置
return(splinesdf)
}
block_lines_df <- splines2splinesdf(block_lines, "id")
pal <- colorFactor("Dark2", domain = 1:length(block_list))
# 左上点轨迹
route0_df <- target_data %>%
slice(row_id) %>%
select(route0) %>%
separate_rows(route0, sep=";") %>%
separate(route0, c('lng', 'lat'), sep=",", convert=T)
# 右上点轨迹
route1_df <- target_data %>%
slice(row_id) %>%
select(route1) %>%
separate_rows(route1, sep=";") %>%
separate(route1, c('lng', 'lat'), sep=",", convert=T)
# 左上点轨迹
route2_df <- target_data %>%
slice(row_id) %>%
select(route2) %>%
separate_rows(route2, sep=";") %>%
separate(route2, c('lng', 'lat'), sep=",", convert=T)
# 左上点轨迹
route3_df <- target_data %>%
slice(row_id) %>%
select(route3) %>%
separate_rows(route3, sep=";") %>%
separate(route3, c('lng', 'lat'), sep=",", convert=T)
m <- leaflet() %>%
addTiles(
'http://webrd0{s}.is.autonavi.com/appmaptile?lang=zh_cn&size=1&scale=1&style=8&x={x}&y={y}&z={z}',
options=tileOptions(tileSize=256, minZoom=9, maxZoom=17, subdomains="1234"),
attribution = '© <a href="http://ditu.amap.com/">高德地图</a>', group="地图"
)
m <- m %>%
addCircleMarkers(data=segment_df, lng=~sender_lng/1e6, lat=~sender_lat/1e6, color="#1B9E77",
group="商家") %>%
addCircleMarkers(data=segment_df, lng=~recipient_lng/1e6, lat=~recipient_lat/1e6, color="#E7298A",
group="用户") %>%
addPolylines(data=block_lines_df, color=~pal(id), group = "block") %>%
addRectangles(data=segment_df, lng1=~s_lng11, lng2=~s_lng12, lat1=~s_lat11, lat2=~s_lat12, color='red',
group = "起始geohash") %>%
addRectangles(data=segment_df, lng1=~e_lng11, lng2=~e_lng12, lat1=~e_lat11, lat2=~e_lat12, color='red',
group = "终止geohash") %>%
addPolylines(data=route0_df, lng=~lng, lat=~lat, color='yellow', group = "左上点路线") %>%
addPolylines(data=route1_df, lng=~lng, lat=~lat, color='black', group = "右上点路线") %>%
addPolylines(data=route2_df, lng=~lng, lat=~lat, color='purple', group = "右下点路线") %>%
addPolylines(data=route3_df, lng=~lng, lat=~lat, color='green', group = "左下点路线") %>%
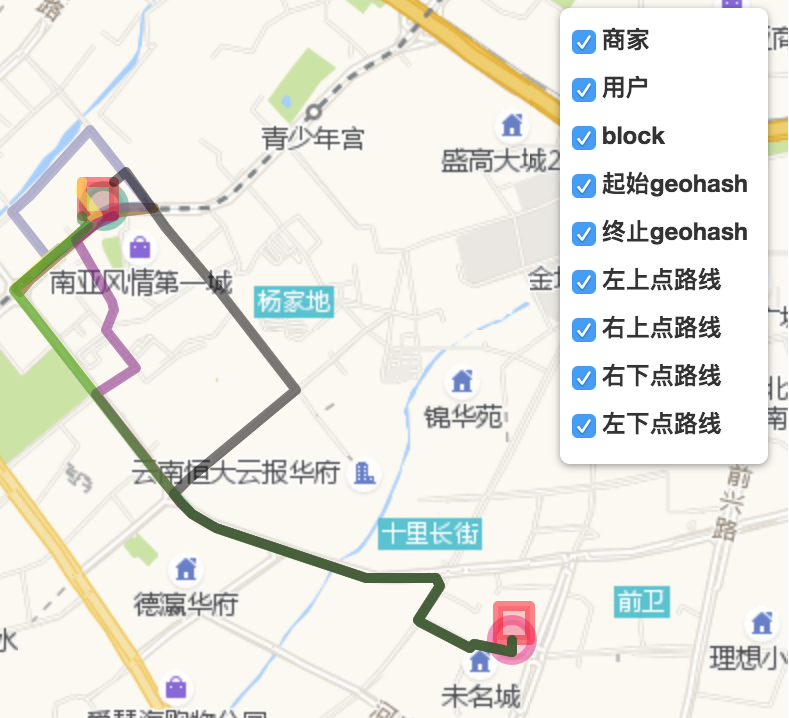
addLayersControl(
overlayGroups = c("商家", "用户", "block", "起始geohash", "终止geohash", "左上点路线", "右上点路线", "右下点路线", "左下点路线"),
options = layersControlOptions(collapsed = FALSE)
)
})
}
# 运行App
shinyApp(ui = ui, server = server)
转载自:https://blog.csdn.net/z363115269/article/details/82907808