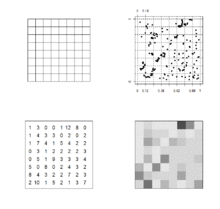
栅格结构(Raster data)
A raster data structure is based on a (usually rectangular, square-based) tessellation of the 2D plane into
cells. In the example the cells of tessellation A is overlayed on the point pattern B resulting in an array C of quadrat counts representing the number of points in each cell. For purposes of visualization a lookup
table has been used to color each of the cells in an image D. Here are the numbers as a simple vector in row/column order:
1 3 0 0 1 12 8 0 1 4 3 3 0 2 0 2 1 7 4 1 5 4 2 2 0 3 1 2 2 2 2 3 0 5 1 9 3 3 3 4 5 0 8 0 2 4 3 2 8 4 3 2 2 7 2 3 2 10 1 5 2 1 3 7
Finally, here is a run-length encoded representation of the raster, which has 55 positions:
values : 1 3 0 1 12 8 0 1 4 3 ...
lengths: 1 1 2 1 1 1 1 1 1 2 ...
This process clearly results in a loss of information, from the real-valued coordinates of
the points, through the integer cell counts, to the ordinal colors, but there are also gains:
- The data structure is usually more compact,
- The raster is easy to visualize, and
- It can be related to other rasters provided the locations and resolutions are
properly conflated.
转载自:https://blog.csdn.net/godblessmyfamily/article/details/11637357


