The Ultimate GIS Dictionary: Your Complete Guide to GIS
GIS is more than just “maps and data”. Instead, it’s multi-disciplinary.
It impacts various sectors and uses different skill sets.
That’s why we’ve put together this list of GIS definitions to give you 20/20 vision.
From A to Z, sharpen your GIS knowledge with these GIS dictionary definitions and meanings.
Jump to Letter
A | B | C | D | E | F | G | H | I | J | K | L | M | N | O | P | Q | R | S | T | U | V | W | X | Y | Z
A
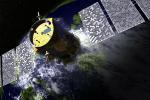
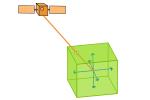
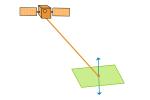
Active Sensors: [Remote sensing] Active sensors illuminates their target and measure the reflected backscatter that returns back to the sensor.
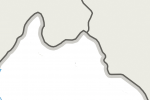
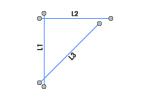
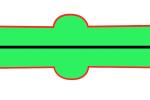
Adjacency: [geometry] Adjacency occurs when two objects share the same boundary and are next to or adjoining with a common side or vertex.

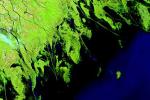
Advanced Very High Resolution Radiometer (AVHRR): [Remote sensing] AVHRR collects infrared, visible, and thermal images with an approximate 1-kilometer spatial resolution cell size.
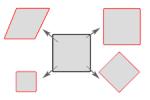
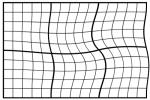
Affine transformation: [geometry] An affine transformation scales, rotates, skews, or translates points, polylines, and polygons preserving points, straight lines, and planes.
Arc: [data structure] Arcs are lines or polygon boundaries, represented as a series of vertices or coordinate points.

ArcCatalog: [software] ArcCatalog is an application in the ArcGIS suite for managing geographic data – similar to windows file explorer.
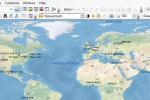
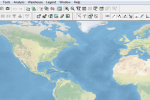
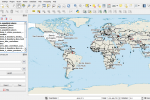
ArcGIS: [software] ArcGIS is a GIS software package produced by the Environmental Systems Research Institute (Esri) which allows you to collect, store, manage, visualize, export, analyze and map geographic data.
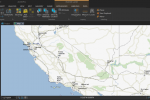
ArcGIS Pro: [software] ArcGIS Pro is Esri’s latest GIS software with a ribbon-based user interface, project files and 64-bit processing.
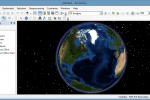
ArcGlobe: [software] ArcGlobe is a 3D visualization and analysis environment as part of the Esri ArcGIS suite (3D analyst), specializing in global datasets and larger study areas.
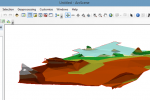
ArcScene: [software] ArcScene is a 3D feature and raster viewer part of the Esri ArcGIS suite of applications (3D analyst) specializing in small study area scenes.
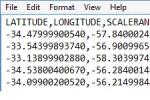
American Standard Code for Information Interchange (ASCII): [file format] ASCII uses a set of numbers between 0 and 255 for information storage and processing.
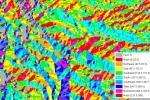
Aspect: [GIS processing] Aspect is the slope direction on a terrain surface measured clockwise starting north as 0° to 360° north again with flat areas given a value of -1 or 0 degree.
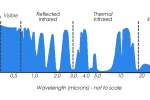
Atmospheric window: [remote sensing] An atmospheric window are wavelengths at which electromagnetic radiation (sunlight) from the sun will penetrate the Earth’s atmosphere overall constricting these spectrum bands from reaching the Earth.
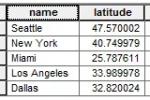
Attribute table: [data structure] An attribute table stores non-spatial information in columns and rows about geographic data – similar to spreadsheets.
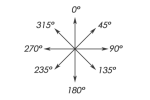
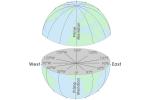
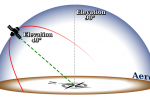
Azimuth: [surveying] An azimuth is an angle between 0° and 360° measured clockwise from north based on true north – Magnetic azimuths are based on magnetic north.
B
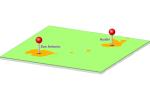
Base station: [surveying] A base station is a precisely surveyed location used as a fixed Global Navigation Satellite System (GNSS) recording station, typically used in differential correction.
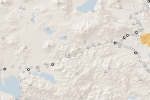
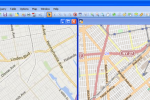
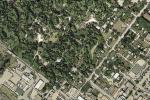
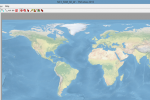
Basemap: [cartography] A basemap is a background, non-editable, georeferenced image that gives a point of reference on a map, providing aesthetic appeal such as aerial imagery, topography, terrain, and street layers.
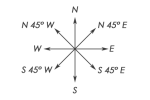
Bearing: [surveying] A bearing is a direction expressed as a geographic angle measured from a baseline used in surveying and navigation.
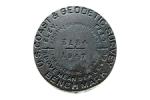
Benchmark: [surveying] Benchmarks are precisely surveyed points usually marked with brass or metal disk in the ground also genetically called survey marks, geodetic marks, and control stations.
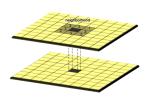
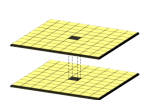
Bilinear interpolation: [mathematics] Bilinear interpolation is a technique for calculating values of a grid location by taking the weighted average of the four neighboring cells in an image to generate new values.

Boolean Algebra: [mathematics] Boolean algebra are conditions used to select features with a set of algebraic conditions including AND, OR, or NOT.
Buffer: [GIS processing] The buffer tool is a proximity function that creates a polygon at a set distance surrounding a selected feature or features.
Bundle adjustment: [geometry] Bundle adjustments remove geometric distortions given a set of images of three-dimensional points at different viewpoints, minimizing the error between observed and predicted image points during reprojection.
C
Carrier-phase GPS: [surveying] Carrier-phase GPS signals are relatively slow but are very accurate (within 10cm or better) to determine position on the ground.
Cartesian coordinate: [surveying] A Cartesian coordinate system specifies each point uniquely with a pair of numerical coordinates or tripless for three-dimensional coordinate spaces.
Cartography: [GIS dictionary] Cartography is the study, aesthetics and science of representing real-world entities on maps by communicating spatial information.
Cartometry: [GIS dictionary] Cartometry is a division of cartography concerned with depicting objects with a high level of spatial accuracy such as measuring the perimeter of coasts, areas of countries, volumes, slopes, and densities.
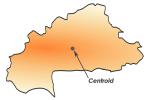
Centroid: [geometry] A centroid (or geometric center) is a central point of an area feature that represents the average position of all the points in the shape.
Clip: [geometry] A clip is an overlay tool that involves clipping an input layer to the extent of a defined feature boundary.

Code-Phase GPS: [GPS] The coarse acquisition (C/A) code or code-phase GPS, which is available to the general public, is a GPS signal that delivers rapid, low accuracy position estimates in tens of meters.
Coordinate Geometry (COGO): [editing] COGO involves the entry of spatial coordinate data points, usually obtained from field survey equipment.
Computer Aided Design/Drafting (CAD): [GIS dictionary] CAD is primarily used by engineers and architects for the purpose of producing two and three-dimensional drawings.
Conformal Projection: [map projection] A conformal map projection preserves the correct shapes of small areas with the scale being the same in all directions and greatly distorted areas.
Conic Projection: [map projection] A conic projection uses a cone to develop its surface on a plane with meridians converging at a single point.
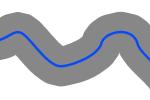
Connectivity: [geometry] Connectivity is the representation of the connectedness of linear features when arcs share a common node.
Continuous raster: [data structure] Continuous rasters are grid cells with gradually changing data such as Digital Elevation Models (DEM), temperature data or distance from features.
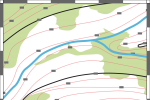
Contour Line: [data structure] A contour line is a constant value for mapping any variable such as elevation, temperature, isopleth or isoline maps.
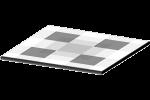
Control point: [coordinate system] Control points are locations known to have a high degree of accuracy that are used to convert digitized coordinates from paper maps and georeferencing to standard map projection coordinates.
Coordinate Transformation: [coordinate system] A coordinate transformation is the conversion from a non-projected coordinate system to a coordinate system using a series of mathematical equations.
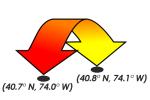
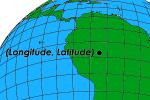
Coordinates: [coordinate system] Coordinates are pairs (X, Y) or triplets (X, Y, Z) of values that are used to represent points and features in a two and three-dimensional space.
Cubic Convolution Interpolation: [mathematics] Cubic convolution interpolation averages the 16 nearest cells, which is generally used for continuous surfaces where much noise exists.
Cylindrical Projection: [map projection] A cylindrical projection uses a cylinder to develop a plane surface such as Mercator and Plate Carree projections.
D

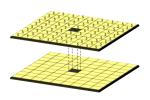
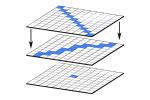
Data Model: [data structure] The two main GIS data models are rasters (pixels with a specific cell size) and vectors (points, lines and polygons).
Database Management System (DBMS): [data structure] A DBMS is a collection of tools that allows the entry, storage, input, output and organization of data, serving as an interface between users and a database.
Database Schema: [data structure] A database schema is supported in relational database management systems (RDBMS) and acts as blueprints for how database entries will be constructed.
Developable Surface: [map projection] A developable surface (cylinders, cones, planes, etc) is the geometric shape that a map projection can be mathematically built on.
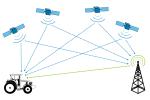
Differential Global Navigation Satellite System (GNSS): [surveying] Differential GNSS is a highly accurate (within centimeters) conventional surveying technique that uses a known location from a receiver to determine an unknown position.
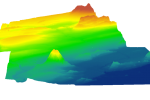
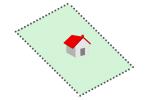
Digital Elevation Model (DEM): [GIS processing] A Digital Elevation Model (DEM) is a bare earth elevation model representing the surface of the Earth without features like houses, bridges, and trees.

Digital Line Graph (DLG): [file format] DLG is vector data format developed and distributed by the United States Geological Survey (USGS) depicting geographic features like terrain, hydrography, transportation and man-made features.
Digital Orthophotos Quadrangle (DOQ): [file format] DOQ is a geometrically-corrected photograph produced by the USGS with a scale of 1:40,000 and spatial resolution of about 1-meter pixels.
Digital Raster Graphics (DRG): [file format] DRG is a digital version map of USGS topographic maps including imagery (NAIP), roads, place names, hydrography, elevation contours, and boundaries.
Digital Surface Model (DSM): [file format] A digital surface model is an elevation model that includes the top of buildings, tree canopy, powerlines and other features above the bare earth.
Digital Terrain Model (DTM): [file format] DTM is a bare earth representation of the Earth’s surface that is augmented by natural features such as ridges and breaklines.
Digitize: [editing] When you digitize in a GIS, you are creating geographic computer-compatible stored data with lines, points, and polygons in a spatial database.
Dissolve tool: [GIS processing] The dissolve tool is a common GIS processing task where boundaries are merged with neighboring boundaries based on common attribute values.
E
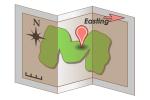
Easting: [coordinate system] Eastings refer to the x-axis (eastward) points approximately parallel to lines of equal latitude commonly used in the Universal Transverse Mercator map projection.
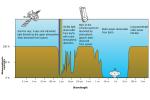
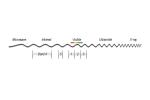
Electromagnetic (EM) Spectrum: [remote sensing] The EM spectrum refers to the range of energy wavelengths or frequencies from x-rays, ultraviolet, visible, infrared, and microwave to radio waves.

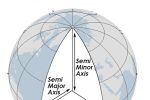
Ellipsoid: [surveying] Reference ellipsoids are mathematical models of the shape of the Earth with the major axis along the equatorial radius, primarily used as a surface to specify point coordinates such as latitude (north/south), longitude (east/west) and elevation (height).
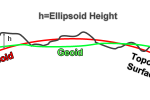
Ellipsoid Height: [surveying] The ellipsoid height is the height measured from an ellipsoidal surface to a point on the surface of the Earth.
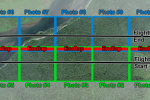
Endlap: [remote sensing] Endlap is the coverage overlap in aerial photographs from end to end between flight lines.
Enhanced Thematic Mapper (ETM+): [remote sensing] ETM+ is a sensor equipped on Landsat-7 which produces images of Earth in 8 spectral bands (blue, green, red, NIR, MIR, panchromatic, and thermal band).
Entity: [cartography] Entities represent a real-world point, line, or polygon features with a geographic location such as fire hydrants, hospitals, state boundaries, roads, rivers, lakes, etc.
Equal Interval Classification: [cartography] The equal interval classification method divides attribute values into equal size ranges such as 0-20, 21-40, 41-60, 61-80, and 81-100.
Earth Resources Data Analysis System (ERDAS) Imagine: [software] ERDAS Imagine is a leading remote sensing software owned by Hexagon Geospatial.

Esri (Environmental Systems Research Institute): [software] Esri is the largest global supplier and developer of GIS software based in Redlands, California.
F
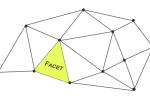
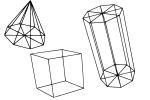
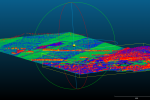
Facet: [data structure] A facet is a triangular face in a Triangular Irregular Network (TIN). TINs are three-dimensional coordinates depicting elevation surfaces.
False northing: [coordinate system] A false northing is a number added in a map projection in the y direction to avoid negative coordinate locations within the specified area of that map projection.
Feature: [data structure] A feature is a cartographic point, line, or polygon object with a spatial location in the real-world landscape that can be used in a GIS for storage, visualization, and analysis.
Field (Attribute Table): [data structure] An attribute field (or item) are characteristics used to describe each feature in a geographic data set usually viewed as columns in a table.
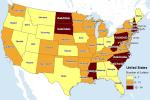
Federal Information Processing Standard (FIPS): [organization] FIPS is a federal unique identifier code used to define political or physical features in the United States.
Flow direction: [GIS processing] Flow direction calculates the direction water will flow using the slope from neighboring cells.
Focal Operation: [mathematics] The focal operation is a spatial function that computes an output value of each cell using neighborhood values such as convolution, kernel, and moving windows.
G

GDAL: [GIS software] Geospatial Data Abstraction Library (GDAL) is a C++ library for reading and writing raster geospatial data formats, implementing common GIS operations (unions, intersections, joins, clipping, etc.) with command line utilities.
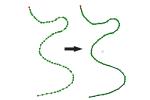
Generalization Tool: [GIS processing] The generalization tool is an editing process that simplifies the shapes by reducing the number of vertices in a line or polygon.
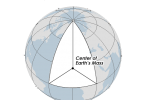
Geocentric: [geodesy] Geocentric is a measuring system that uses the center of the Earth as its origin, such as the WGS 1984 datum.
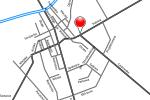
Geocoding: [GIS processing] Geocoding is the process of assigning geographic coordinates to places based on street address, town/city, province/state and country.

Geodesy: [GIS dictionary] Geodesy (or Geodetics) is a branch of applied mathematics and earth science of locating and assigning three-dimensional points on Earth by measuring the shape of the Earth.
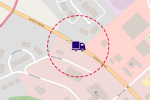
Geofencing: [GIS dictionary] A virtual geographic boundary designed to give real-time alerts and increase awareness.

Geographic Information Systems (GIS): [GIS dictionary] GIS is a computer-based tool that analyzes, stores, manipulates and visualizes geographic information on a map, good for finding spatial patterns, relationships and trends.
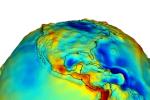
Geoid: [geodesy] A geoid is a measurement-based equipotential surface model of the shape of the Earth primarily used as a basis of assigning terrain height.
Geomedia: [software] GeoMedia is a GIS software package produced by Hexagon Geospatial (previously Intergraph) used to analyze, store and visualize geographic data.
Global Mapper: [software] Global Mapper is a commercial GIS software product for spatial analysis and visualization.
Global Operation: [mathematics] A global operation is a process or function that is performed on each output cell using all of the cells of the input raster.
Gnomonic Projection: [map projection] A Gnomonic projection uses the center of the spheroid as the projection center.
GRASS GIS: [software] GRASS GIS (Geographic Resource Analysis Support System) is an open source GIS software package, highly used in academic institutions with over 400 modules for GIS analysis.
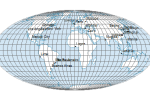
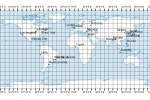
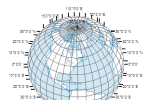
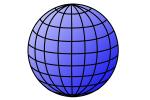
Graticule: [coordinate system] Graticules are lines of latitude or longitude on a digital or hard copy map and assist in showing the geographic locations of map features.
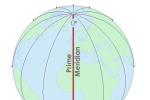
Greenwich Meridian (Prime Meridian): [coordinate system] The Greenwich meridian passes through the Royal Observatory in Greenwich, England, and is defined as a 0° line of longitude.
Geodetic Reference System 1980 (GRS 80): [geodesy] GRS80 is a geodetic reference system consisting of a global reference ellipsoid and a gravity field model (geoid).
H
Horizontal Datum: [geodesy] A horizontal datum provides a frame of reference as a basis for placing locations at a specific latitude and longitude points on the spheroid.
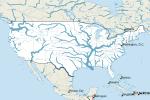
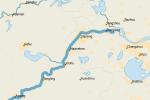
Hydrography: [GIS dictionary] Hydrography is a term describing the geographic representation of water features such as streams, rivers, and lakes.
Hypsography: [ GIS dictionary ] Hypsography is the geographic representation of features on a map related to elevation, altitude, and height above sea level from a reference surface. (Hypso is Greek for height).
I
Idrisi: [software] Idrisi is a GIS/remote sensing software package developed by Clark Laboratories in 1987, widely used in the education system.
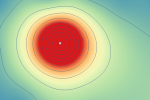
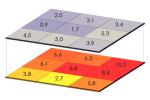
Inverse Distance Weighted (IDW) Interpolation: [mathematics] IDW interpolation is a technique used to estimate values of unsampled locations based on the value and distance of known, sampled locations.
IKONOS: [remote sensing] IKONOS is a high-resolution commercial imaging satellite that provides 1-meter panchromatic and 3-meter multispectral (blue, green, red, near-infrared) imagery.
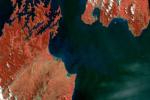
Infrared: [remote sensing] An infrared image represents reflectance grid cells that are recorded in the near-infrared wavelengths, typically 0.7 to 1.1 micrometers.
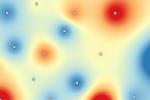
Interpolation: [mathematics] Interpolation is the estimation of unsampled locations based on known location sampled values such as elevation, temperature, and other predicted variables.
Intersect Tool (Overlay): [GIS processing] The intersect tool uses two inputs and restricts the output geometry similar to a clip by preserving the attributes in both input layers.
K

Kriging: [GIS processing] Kriging is a statistical interpolation technique that uses known location values to interpolate values at unknown locations and also estimates standard error and uncertainty.
L
Land Information System (LIS): [GIS dictionary definition] LIS was a name originally applied for GIS systems specifically developed for property ownership and boundary records management.
Landsat: [remote sensing] Landsat consists of 8 satellite missions spanning more than 4 decades with space-borne remote sensing capabilities for scanning land resources.
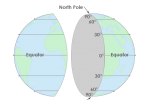
Latitude: [coordinate system] Latitudes are spherical coordinates of Earth locations that vary in north-south directions ranging from 0° at the Equator to 90° (North or South) at the poles.
Light Detection and Ranging (LiDAR): [remote sensing] LiDAR uses laser pulse measurements to identify heights, depths, and other properties of features on the Earth’s surface.
Local Operator: [GIS processing] A local operation is a spatial operation where the output extent is limited to the same location as the input such as arithmetic, statistical, relational, trigonometric, exponential, and logarithmic operations.

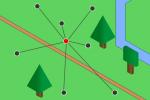
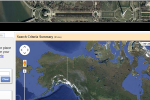
Locator Map: [cartography] Locator maps show the extent of the primary map in relation to a larger extent area giving context to the map reader to gain a better understanding of the overall area.
Longitude: [coordinate system] Longitudes are coordinate on Earth in east-west directions ranging from 0° to +180° east and −180° west.
M
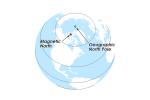
Magnetic North Pole: [geodesy] The magnetic north is a point in Northern Canada where the northern lines of attraction enter the Earth and which compass needles orient in direction.
Manifold GIS: [software] Manifold is a GIS software package used for mapping with a focus on speed in analysis and visualization.
Map Algebra: [mathematics] Map algebra is the combination of spatial data using mathematical, statistical, and trigonometric operations to generate new raster outputs.
Map Legend: [cartography] A map legend is a visual graphic of the symbology used in a map that tells the map reader what polygons, lines, points, or grid cells represent.
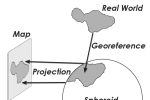
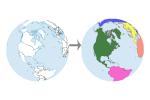
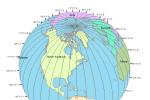
Map Projection: [cartography] A map projection is a systematic rendering of features that transforms a 3D ellipsoid or spheroid of Earth into a 2D map surface with some distortion.
MapInfo: [software] MapInfo by Precisely (founded in 1986) is a GIS location intelligence suite that allows users to manage, view, and create geospatial data.
Meridian: [coordinate system] Meridians are lines of longitude that vary in east-west directions ranging from 0° to +180° east and −180° west.
Metadata: [data structure] Metadata is data that describes data such as the date, abstract, coordinate system, attribute information, origin, and accuracy.

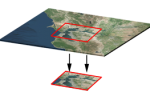
Minimum Mapping Unit: [remote sensing] A minimum mapping unit is the smallest resolution area when interpreting remotely-seemed satellite or aerial imagery.
Moderate Resolution Imaging Sensor (MODIS): [remote sensing] MODIS is a high spectral resolution and moderate spatial resolution (250-1000 meters) imaging scanner.
Moving Window: [mathematics] A moving window is a rectangular arrangement of cells that applies an operation to each cell in a raster dataset while shifting in a position entirely.
Multispectral Imagery: [remote sensing] A multispectral image had several channels consisting of several spectral bands of wavelengths such as red, green, blue, and NIR.
N
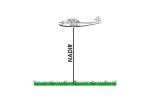
Nadir: [remote sensing] Nadir is the point directly below the aircraft which is usually near the center of the aerial image.
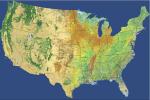
National Land Cover Dataset (NLCD): [organization] The NLCD is a Landsat Thematic Mapper (TM) based classification of land cover in the United States.

National Oceanic and Atmospheric Administration (NOAA): [organization] NOAA is the US government agency that oversees the development of national datums and several weather and ocean satellites.
National Wetlands Inventory (NWI): [organization] The NWI is a dataset compiled by the US Fish and Wildlife Services that describes the type and extent of wetlands in North America.

Nearest Neighbor Interpolation: [mathematics] Nearest neighbor interpolation involves taking the output value from the nearest input layer cell center, commonly used for discrete data like land covers.
Neat Line: [cartography] A neat line is a solid border cartographic element that surrounds all the data, legend, scale, and other features helping the map readers focus on the inner details in a map.
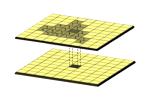
Neighborhood Operation: [mathematics] A neighborhood operation is a spatial function where the output location, area, and extent come from areas larger than and adjacent to the input cells.
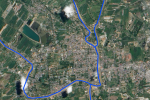
Network: [data structure] A network in GIS is a connected set of line features used to model for and demand through real-world networks such as rivers and roads.
Node: [data structure] A node is an important point along a line feature where two lines intersect.
Nominal Scale: [cartography] A nominal scale is a type of measurement that indicates the difference between classes or categories of data.
North American Datum 1927 (NAD27): [geodesy] NAD27 is the adjustment of long-baseline surveys to establish a network of standardized horizontal positions in North America using the Clarke Ellipsoid of 1866 and a fixed center at Meade’s Ranch, Kansas.
North American Datum of 1983 (NAD83): [geodesy] NAD83 is the successor of NAD27 that creates a set of standard horizontal positions for North America based on the reference ellipsoid GRS80.
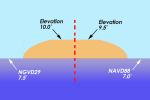
North American Vertical Datum of 1929 (NAVD29): [geodesy] NAVD29 or National Geodetic Vertical Datum of 1929 (NGVD29) gives a vertical measurement network reference frame for which vertical elevations and depressions can be based in North America.
North American Vertical Datum of 1988 (NAVD88): [geodesy] NAVD88 is a vertical datum that provides a reference surface in which vertical heights (altitude) and depth (depression) above and below mean sea level is measured.
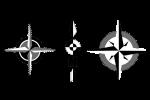
North Arrow: [cartography] A north arrow provides an orientation to the map reader by showing the north direction as a graphical depiction.
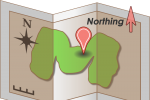
Northing: [coordinate system] A northing is the axis in the approximate north-south direction (or y-value) in UTM and other standard coordinate systems.
O
Object Based Image Analysis (OBIA): [remote sensing] OBIA is an image classification technique that segments images and classifies them using spectral, spatial, and relational properties and characteristics.
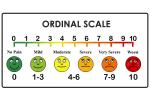
Ordinal Scale: [coordinate system] An ordinal scale represents the relative order of values but does not record the magnitude of differences between values.
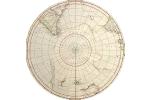
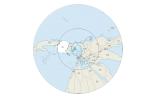
Orthographic Projection: [map projection] An orthographic projection is a map projection that represents 3D data in 2D where all the projection lines are orthogonal to the projection plane.
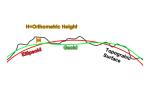
Orthometric Height: [map projection] Orthometric height is a height measured from the Geoid surface to a point on the surface of the Earth.
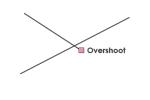
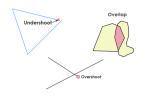
Overshoot: [editing] An overshoot is a digitized line that extends past the intended line of connection.
P
Panchromatic Image: [editing] A panchromatic image records wavelengths in only one wider range band resulting in grayscale images.
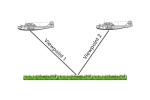
Parallax : [remote sensing] Parallax measures the apparent shift in relative positions of Earth features when it is viewed in different locations.
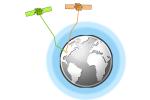
Passive Sensors: [remote sensing] Passive sensors measure natural energy from the sun as reflected sunlight or thermal radiation such as Landsat, SPOT, and GeoEye.
Pixels (GIS): [data structure] Pixels are the grid cells that make up raster images, which are identical in size.
Planar Topology: [editing] Planar topology requires that intersections for lines and polygons in a digital data layer are enforced and that no two lines or polygons cross.
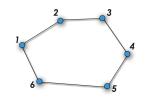
Polygon: [data structure] A polygon is a closed, connected set of lines that defines a geographic boundary with an area and perimeter such as lakes, forests, and country boundaries.
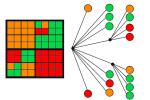
Positional Dilution of Precision (PDOP): [data structure] PDOP is a quantitative measurement used to represent the quality of the satellite geometry when taking GPS readings.
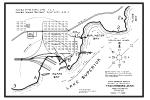
Public Land Survey System (PLSS): [organization] The PLSS is a land measurement system used in the western United States to define parcel boundaries and locations.
Q
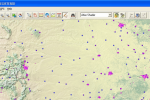
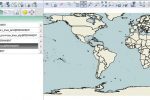
QGIS: [software] QGIS (formerly Quantum GIS) is a free and open source software package that allows you to create, edit, visualize, analyze and publish geospatial information.
Quad-Trees: [remote sensing] Quad-Trees are raster data structures based on successive reduction of homogeneous cells for the purpose of reducing storage requirements.
Quantile Classification: [cartography] Quantile classification is a classification method that divides classes so that the total number of features in each class is approximately the same.

Query: [programming] A query is a request or search of spatial or tabular data based on user-defined criteria, resulting in a subset of selected records.
R

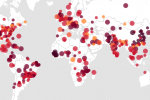
Random Location Sampling: [statistics] Random location sampling is a statistical technique where sample locations are selected by a random process with minimal biases.
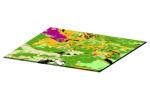
Raster Data: [data structure] A raster is a data model used in GIS which is usually regularly-size rectangular or square shaped grid cells arranged in rows in columns.

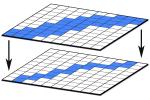
Raster Resampling: [mathematics] Raster resampling is a technique used to recalculate and assign new cell values when adjusting the cell size or orientation of a raster grid.

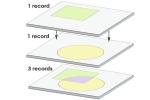
Record: [data structure] A record is an attribute table row that specifies an instance or spatial feature of an entity.
Registration : [GIS processing] Registration is the alignment or assignment of coordinates from a non-projected coordinate system to a coordinate system.
Remote Sensing: [GIS dictionary definition] Remote sensing is the science of obtaining information about the Earth without physically being there, such as by satellite, unmanned aerial vehicle and aircraft.
Rubbersheeting : [mathematics] Rubbersheeting is a transformation technique using polynomial or other non-linear functions to match feature geometry.
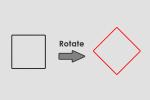
Rotate: [mathematics] Rotation is an affine transformation that changes polylines, polygons in a plane by changing the angle with a pivot location.
S
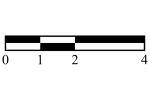
Scale Bar: [mathematics] A scale bar graphically shows the proportional distance on the map with units such as kilometers or meters.
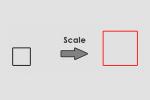
Scale: [mathematics] An affine transformation changes points, polylines, polygons in a plane by scaling, rotating, skewing, or translating coordinates in two or three-dimensional spaces.

Selection Tool: [GIS processing] The selection tool identifies an object or set of objects based on user-selected criteria and properties, typically with Structured Query Language (SQL).
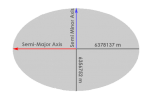
Semi-Major/Minor Axis: [geodesy] The semi-major axis is one-half of the major axis that is the larger of the two radial axes that define an ellipsoid.
Semivariance: [statistics] Semivariance is the variance between valued samples given an inter-sample distances known as lag.
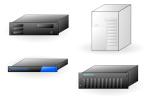
Server: [hardware] A server is a computer component that offers data storage and organization providing subsets of GIS data in response to user requests.
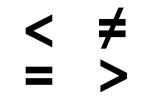
Set Algebra: [mathematics] Set algebra is a method to select items in a database based on operators such as “greater than”, “less than”, “equal to” or ‘not equal to’ using command lines such as SQL.
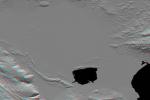
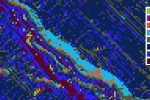
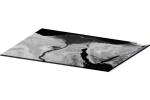
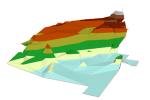
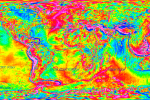
Shaded Relief: [remote sensing] A shaded relief map displays the brightness and shadows of terrain reflection given a sun angle and direction of sunlight.
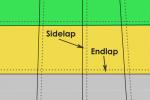
Sidelap: [remote sensing] Sidelap (or side overlap) consists of the overlapping edge areas of photographs between adjacent flight lines.
Skeletonize: [GIS processing] Skeletonizing is the process of thinning a raster line to a single pixel width, typically for conversion to vector data format.
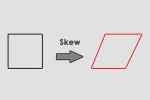
Skew: [mathematics] Skewing distorts a feature by arranging its vertices in the x or y-direction.
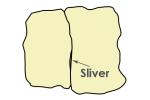
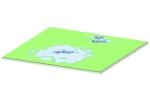
Sliver: [editing] A sliver is a small, spurious gap between polygons often considered as a topology error from imprecise digitization of features.
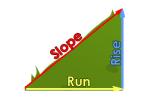
Slope: [mathematics] Slope is the change in elevation or steepness with respect to change in location measured in degrees or percent slope.
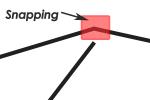
Snapping Environment: [editing] Snapping determines the distance that newly digitized points, lines, and polygons will occupy the same location as existing features.
Soil Survey Geographic Database (SSURGO): [organization] SSURGO is a fine-scale, county-level, soil survey database prepared by the National Resource Conservation Service.
Spaghetti Data Model: [data structure] The spaghetti data model is a simple and dated GIS model where lines may cross without intersecting or topology without attributes.
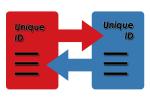
Spatial Relationship: [data structure] A spatial relationship that links features geographically with a table by a unique identifier.
Spherical Coordinates: [coordinate system] Spherical coordinates is a coordinate system based on a sphere defined by two angles of rotation in orthogonal planes such as latitudes and longitudes in a geographic coordinate system.
Spheroid: [geodesy] A spheroid is a three-dimensional mathematical model representing the shape of the Earth based on the equation of a sphere.
Spline: [mathematics] A spline is an interpolation method that generates a smooth surface by using multiple constrained polynomial functions minimizing the overall surface curvature.
State Plane Coordinates: [coordinate system] State Plane Coordinates is a standardized system in the United States based on Lambert conformal conic and transverse Mercator projections.
State Soil Geographic (STATSGO): [organization] STATSGO is a coarse resolution digital soil dataset from detailed and derived soil survey maps.
Stereo Pairs: [remote sensing] Stereo pairs are overlapping photos taken at different positions that have parallax.

Stereographic Projection: [map projection] A stereographic projection is a mapping function that projects an entire sphere on a plane, except at the projection point.

Structured Query Language (SQL): [map projection] SQL is a set of commands used to manage data stored in relational database management systems (RDBMS).
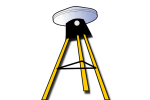
Survey Station: [surveying] Survey stations are position where surveys are performed during land surveys.
Systematic Sampling: [statistics] Systematic sampling involves selecting samples using a regular and ordered sampling framework.
Système Pour l’Observation de la Terre (SPOT) Satellites: [remote sensing] SPOT satellites are a group of French high resolution optical imaging Earth observation satellite which has been in operation for nearly 35 years.
T
Terrestrial Reference System: [geodesy] The terrestrial reference system is a set of measured points used to define a geodetic datum.
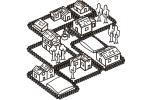
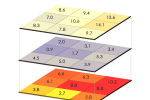
Thematic Layer: [data structure] A thematic layer is a distinct spatial entity in a data layer that is usually delineated as points, lines, and polygons.
Thematic Mapper (TM): [remote sensing] The Thematic Mapper is a high-resolution scanner on Landsat satellites (Landsat 4 and 5) that collects images in visible, near infrared, mid infrared, and thermal bands of the EM spectrum.
TNTmips: [software] TNTmips is a GIS software application produced by Microimages that specializes in image manipulation and vector processing.
Topography: [software] Topography is the study and mapping of Earth’s features including land surfaces, relief, natural, and constructed features.
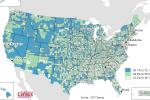
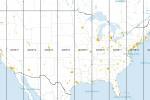
Topologically Integrated Geographic Encoding and Referencing (TIGER): [organization] TIGER is the central hub for United States census data with an inventory of other spatial data related to rivers, lakes, buildings, cities, political areas, and roads.
Topology: [editing] Topology is a set of rules that dictates the spatial properties of point, line, and area features such as connectivity, adjacency and contiguity.
Traverse: [surveying] A traverse is a set of survey stations spanning along a survey and are closed when returning to a starting point.
Triangular Irregular Networks (TIN): [data structure] TINs are vector-based models depicting three-dimensional elevation surface terrains.
U
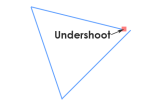
Undershoot: [editing] An undershoot is considered to be a digitizing error in which the new line falls short of the intended connection segment.
Union Tool: [GIS processing] The union tool spatially combines two data layers preserving the features and attributes from both layers at the same extents.
United States Geological Survey (USGS): [organization] USGS is a United States agency responsible for Landsat satellites, nationwide map-making, and spatial data development.
Universal Transverse Mercator (UTM): [coordinate system] UTM coordinate system is a standard set of map projections with a central meridian for each six-degree wide UTM zone.
V
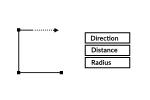
Variable Distance Buffer: [GIS processing] Variable distance buffer uses a feature attribute from the input to create a ring around the feature that varies in distance.
Vector Data Model: [data structure] A vector data model is a common GIS feature representation of spatial information based on defining coordinates and attribute information in points, polylines and polygons.
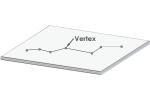
Vertex: [data structure] A vertex is a point that specifies a position on a line for arcs, polylines polygons.
Vertical Datum: [geodesy] A vertical datum is a reference surface to which vertical heights are measured from the zero surfaces to which elevations or depths are referred.
Vertical Dilution of Precision (VDOP): [GPS] VDOP is a quantitative measurement used to represent the quality of the height based on satellite geometry when taking GPS readings.
W
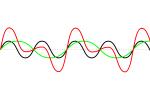
Wavelength: [remote sensing] An electromagnetic wave produce sinusoidal patterns with the distance between the peak and trough of a wave for successive waves.
Web Mapping Service (WMS): [Web Mapping] A WMS is pre-established tiles on the server side for viewing only that have features pre-cached at a set of scales.
Web Feature Service (WFS): [Web Mapping] A Web Feature Service allows you to visualize and edit features (points, lines, and polygons) over the internet.
Wide Area Augmentation System (WAAS): [GPS] WAAS is a satellite-based signal correction that improves the estimation of GPS positions primarily by removing atmospheric distortion.
World Geodetic System 1984: [geodesy] WGS84 is a reference ellipsoid used for defining spatial locations in three dimensions.
Z
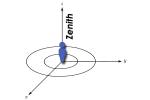
Zenith: [mathematics] Zenith is the angle measured directly in the z-direction (vertical direction opposite to the apparent gravitational force) on the imaginary celestial sphere at that location.
Zonal Operation: [mathematics] A zonal operation is a spatial function that computes an output value of each cell using the zone containing that cell.