leaflet.js/proj4.js自定义坐标系及使用
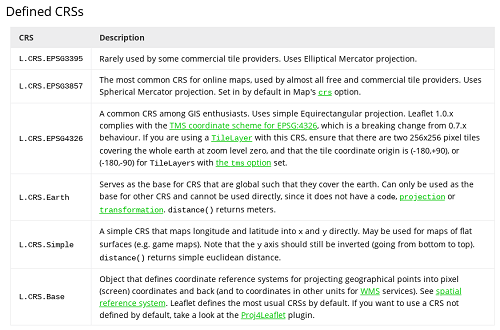
leaflet官方定义的坐标系不多,没有openlayers自身集成了许多功能,如下:

可以借助leaflet插件来定义坐标系,本文用proj4.js + proj4leaflet.js + 相应参数来定义想要的坐标系,如EPSG:4549。EPSG:4549也就是CGCS2000 / 3-degree Gauss-Kruger CM 120E坐标系,投影坐标系,以米为单位,相关参数见https://epsg.io/4490。从网站中可获得:
EPSG:4549的WKT描述:
PROJCS["CGCS2000 / 3-degree Gauss-Kruger CM 120E",
    GEOGCS["China Geodetic Coordinate System 2000",
        DATUM["China_2000",
            SPHEROID["CGCS2000",6378137,298.257222101,
                AUTHORITY["EPSG","1024"]],
            AUTHORITY["EPSG","1043"]],
        PRIMEM["Greenwich",0,
            AUTHORITY["EPSG","8901"]],
        UNIT["degree",0.0174532925199433,
            AUTHORITY["EPSG","9122"]],
        AUTHORITY["EPSG","4490"]],
    PROJECTION["Transverse_Mercator"],
    PARAMETER["latitude_of_origin",0],
    PARAMETER["central_meridian",120],
    PARAMETER["scale_factor",1],
    PARAMETER["false_easting",500000],
    PARAMETER["false_northing",0],
    UNIT["metre",1,
        AUTHORITY["EPSG","9001"]],
    AUTHORITY["EPSG","4549"]]
EPSG:4549的PROJ.4描述:
+proj=tmerc +lat_0=0 +lon_0=120 +k=1 +x_0=500000 +y_0=0 +ellps=GRS80 +units=m +no_defs这里不深入讨论描述的参数。看代码:
// 定义坐标系
const CRS_4549 = new L.Proj.CRS('EPSG:4549',
    '+proj=tmerc +lat_0=0 +lon_0=120 +k=1 +x_0=500000 +y_0=0 +ellps=GRS80 +units=m +no_defs',  // EPSG:4490的PROJ.4描述
    {
        resolutions: [
            156367.7919628329  // 0
            ,78183.89598141646
            ,39091.94799070823
            ,19545.973995354114
            ,9772.986997677057
            ,4886.4934988385285
            ,2443.2467494192642
            ,1221.6233747096321
            ,610.8116873548161
            ,305.40584367740803
            ,152.70292183870401
            ,76.35146091935201
            ,38.175730459676004
            ,19.087865229838002
            ,9.543932614919001
            ,4.7719663074595005
            ,2.3859831537297502
            ,1.1929915768648751
            ,0.5964957884324376
            ,0.2982478942162188  // 19
        ]
    }
);
resolutions的可以通过openlayers等方式来获取,最现成的方式是参照GeoServer发布的服务图层预览界面代码。
测试代码,加载天地图WMS服务:
// 经纬度单位,注意纬度在前
let center = [31.3456789123, 121.789876543];
// 地图对象
const map = L.map('map', {
    center: center,
    zoom: 6,
    crs: CRS_4549  // 定义的坐标系
});
// 服务是2000坐标系
L.tileLayer.wms("http://gisserver.tianditu.com/TDTService/ew/2014/wms", {
    layers: '060601',  // 资源名称
    format: 'image/png',
    transparent : true
}).addTo(map);
// 画一个圆
L.circle(center, {radius: 100000}).addTo(map);
// 地理点单位转化
let center_latLng = L.latLng(center);
// 转平面坐标描述的点
let center_latLng_project = CRS_4549.project(center_latLng);
// 输出只:L.Point {x: 670333.9079398193, y: 3470684.886947584}
console.log(center_latLng_project);
// 转经纬度描述的点
let center_latLng_project_unproject = CRS_4549.unproject(center_latLng_project);
// 输出值:L.LatLng {lat: 31.345678912291856, lng: 121.78987654308136}
// 有些点下会只有7位左右的小数和原数据匹配,渲染已经满足。
console.log(center_latLng_project_unproject);
渲染投影坐标的GeoJSON:
    // 渲染geojson,投影坐标描述
    let geojson = {
        "type":"FeatureCollection",
        "features":[
            {
                "type":"Feature",
                "id":"polygon.1",
                "geometry":{
                    "type":"MultiPolygon",
                    "coordinates":[
                        [[
                            [550333.9079398193,3470684.886947584],
                            [460333.9079398193,3070684.886947584],
                            [348333.9079398193,2970684.886947584],
                            [550333.9079398193,3470684.886947584]]
                        ]]
                },
                "properties":{"name": "rect"}
            }
        ],
        "crs":{
            "type":"name",
            "properties":{"name":"EPSG:4549"}   // EPSG:4549
        }
    };

    // L.Proj.GeoJSON继承于L.GeoJSON,可调样式
    L.Proj.geoJson(geojson,{
        style: {
            "color": "#ff0000",
            "weight": 5,
            "opacity": 0.65
        }
    }).addTo(map);
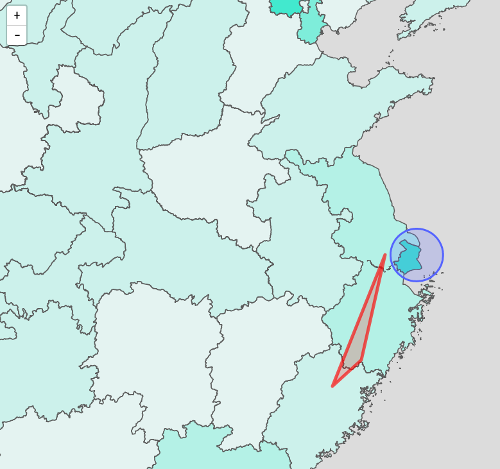
预览图:

leaflet很多方法或情况下是只支持经纬度数据操作的,而非投影值的操作,有时需作坐标转换。上述代码给了一个坐标变换示例,坐标变换次数过多,会带来大的误差,精确度需求较高的场合不宜做变换,只适合渲染显示。
完整的代码如下:
<html>
<head>
    <title>地图示例</title>
    <script src="leaflet/leaflet-src.js"></script>
    <script src="leaflet/proj4-src.js"></script>
    <script src="leaflet/proj4leaflet.js"></script>
    <link rel="stylesheet" href="leaflet/leaflet.css"/>
</head>
<body style="overflow: hidden">
<div id="map" style="height:800px;width: 1300px;float: left"></div>
<div style="width: 20px;height: 100px;float: left"></div>
<script>

    const resolutions = [
        156367.7919628329
        ,78183.89598141646
        ,39091.94799070823
        ,19545.973995354114
        ,9772.986997677057
        ,4886.4934988385285
        ,2443.2467494192642
        ,1221.6233747096321
        ,610.8116873548161
        ,305.40584367740803
        ,152.70292183870401
        ,76.35146091935201
        ,38.175730459676004
        ,19.087865229838002
        ,9.543932614919001
        ,4.7719663074595005
        ,2.3859831537297502
        ,1.1929915768648751
        ,0.5964957884324376
        ,0.2982478942162188
    ];  // 0 19

    const CRS_4549 = new L.Proj.CRS('EPSG:4549',
        '+proj=tmerc +lat_0=0 +lon_0=120 +k=1 +x_0=500000 +y_0=0 +ellps=GRS80 +units=m +no_defs',
        {
            resolutions: resolutions
        }
    );

    // 经纬度单位,注意纬度在前
    let center = [31.3456789123, 121.789876543];
    // 地图对象
    const map = L.map('map', {
        center: center,
        zoom: 6,
        crs: CRS_4549  // 定义的坐标系
    });

    // 服务是2000坐标系
    L.tileLayer.wms("http://gisserver.tianditu.com/TDTService/ew/2014/wms", {
        layers: '060601',  // 资源名称
        format: 'image/png',
        transparent : true
    }).addTo(map);

    // 画一个圆
    L.circle(center, {radius: 100000}).addTo(map);

    // 地理点单位转化
    let center_latLng = L.latLng(center);

    // 转平面坐标描述的点
    let center_latLng_project = CRS_4549.project(center_latLng);
    // 输出只:L.Point {x: 670333.9079398193, y: 3470684.886947584}
    console.log(center_latLng_project);

    // 转经纬度描述的点
    let center_latLng_project_unproject = CRS_4549.unproject(center_latLng_project);
    // 输出值:L.LatLng {lat: 31.345678912291856, lng: 121.78987654308136}
    console.log(center_latLng_project_unproject);

    // 渲染geojson,投影坐标描述
    let geojson = {
        "type":"FeatureCollection",
        "features":[
            {
                "type":"Feature",
                "id":"polygon.1",
                "geometry":{
                    "type":"MultiPolygon",
                    "coordinates":[
                        [[
                            [550333.9079398193,3470684.886947584],
                            [460333.9079398193,3070684.886947584],
                            [348333.9079398193,2970684.886947584],
                            [550333.9079398193,3470684.886947584]]
                        ]]
                },
                "properties":{"name": "rect"}
            }
        ],
        "crs":{
            "type":"name",
            "properties":{"name":"EPSG:4549"}   // EPSG:4549
        }
    };

    // L.Proj.GeoJSON继承于L.GeoJSON,可调样式
    L.Proj.geoJson(geojson,{
        style: {
            "color": "#ff0000",
            "weight": 5,
            "opacity": 0.65
        }
    }).addTo(map);

</script>
</body>
</html>转载自:https://blog.csdn.net/aliasone/article/details/80355184


